Debug your app with Shopify App Bridge
Shopify App Bridge includes a number of features to help you debug your app.
If you’re using Typescript, then Shopify App Bridge is fully typed. If you’re not using Typescript, then Shopify App Bridge includes a development version which throws informative, Typescript-like errors.
Under the hood, Shopify App Bridge uses Redux to manage actions and app state. All actions dispatched by your app are recorded by Redux, and you can use Redux DevTools to review, replay, and dispatch actions to help you debug.
Redux DevTools are only available when an app is running in a development store. Note: Although Shopify App Bridge uses Redux, you do not need to use Redux in your app to get the benefits of the DevTools extension.
Redux DevTools are only available when an app is running in a development store. Note: Although Shopify App Bridge uses Redux, you do not need to use Redux in your app to get the benefits of the DevTools extension.
Anchor to Using the development version for informative errorsUsing the development version for informative errors
The development version of Shopify App Bridge adds a validation system that throws informative, Typescript-like errors.
The development version is not intended for production use because the validation system adds to the file size.
The development version is not intended for production use because the validation system adds to the file size.
Anchor to Example errorExample error
Creating a Toast with the following options is invalid:
If you tried to create a Toast with the example above, then the development version of App Bridge would throw the following error:
Output
As you can see, the Toast action set expects the duration option to be an integer, but the value in the example is a string.
Without the development version’s validation system, Shopify App Bridge will not throw errors for invalid options.
Anchor to Using ES modulesUsing ES modules
If you’re importing Shopify App Bridge by using ES modules, then add NODE_ENV=development to your build tooling configuration.
You can also use the development version without modifying your NODE_ENV variable by importing createApp from the development subdirectory:
Anchor to Set up Redux DevToolsSet up Redux Dev
- Follow the instructions to install Redux DevTools in your browser. The following examples are based on using Google Chrome, but similar steps apply for Firefox.
- Open your app in a development store.
- Open the Redux DevTools.
Anchor to Using Redux DevToolsUsing Redux Dev
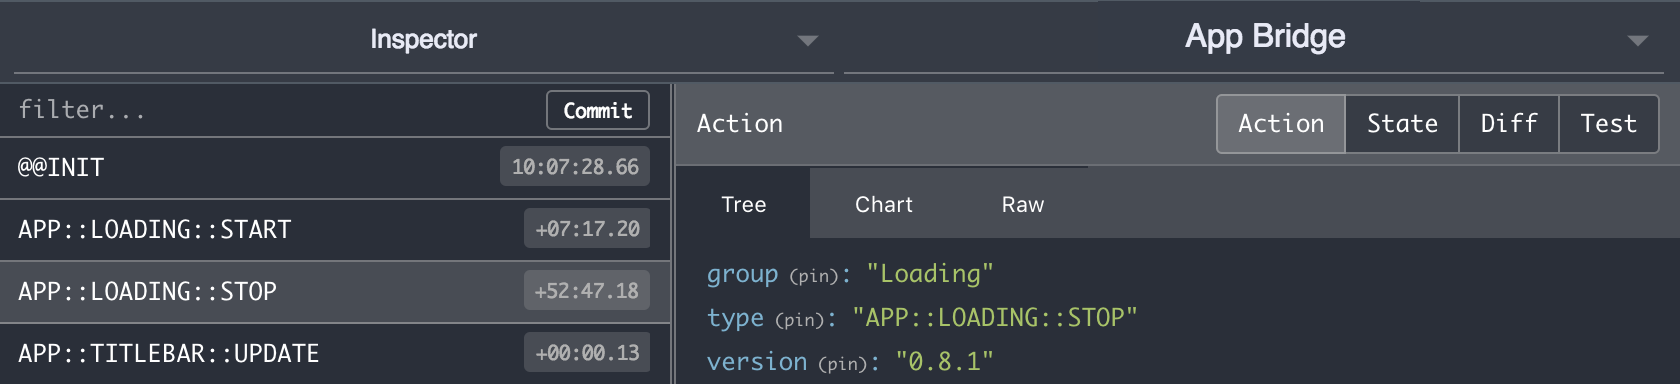
From the Inspector tab in Redux DevTools, select the App Bridge instance. You should see a list of all dispatched App Bridge actions on the left-hand side.
Click on an action in the list to get more information about that action.
Anchor to ActionAction
After you select an action, click the Action tab to get more information about the action's payload.
Anchor to StateState
After you select an action, click the State tab to see the state of the Shopify App Bridge data store after the action was dispatched. Your app state is contained in the appBridge.store property. You can click (pin) next to appBridge.store to bookmark this property so you can quickly review the state. The information shown here is identical to what you get when calling app.getState locally on your app.
Anchor to DiffDiff
After you select an action, click the Diff tab to see the difference between your app state after the action was dispatched. In the following example, a LOADING::CLEAR action was dispatched to set the loading state to false:
Anchor to Replaying actionsReplaying actions
In Redux DevTools, click the clock icon to open the playback controller. This lets you step backward and forward through actions, and replay them in sequence.
Anchor to Dispatching actionsDispatching actions
Redux DevTools allows you to manually dispatch actions directly on the store.
Click the keyboard icon to open the dispatcher. This lets you quickly debug without using any code. Each action must contain the following properties: type, group, and version. The payload property is optional, depending on the action being dispatched.
Shopify App Bridge automatically fills out the required values for you when dispatching actions through an app. When using the DevTools to dispatch, you must supply the required values yourself.
Here is an example of a show Toast action:
You can paste the above directly inside the dispatcher and press Dispatch to submit the action:
Anchor to Debugging App Bridge apps on an iOS DeviceDebugging App Bridge apps on an i
Requirements:
-
A Mac running MacOS
-
An iOS device plugged into the Mac
Anchor to Opening the Console appOpening the Console app
By default, MacOS includes the Console app in your Utilities folder. To open the app:
- Open a new Finder window
- Navigate to Applications > Utilities
- Double-click on Console.
You can also open the Console app by activating Spotlight and searching for "Console".
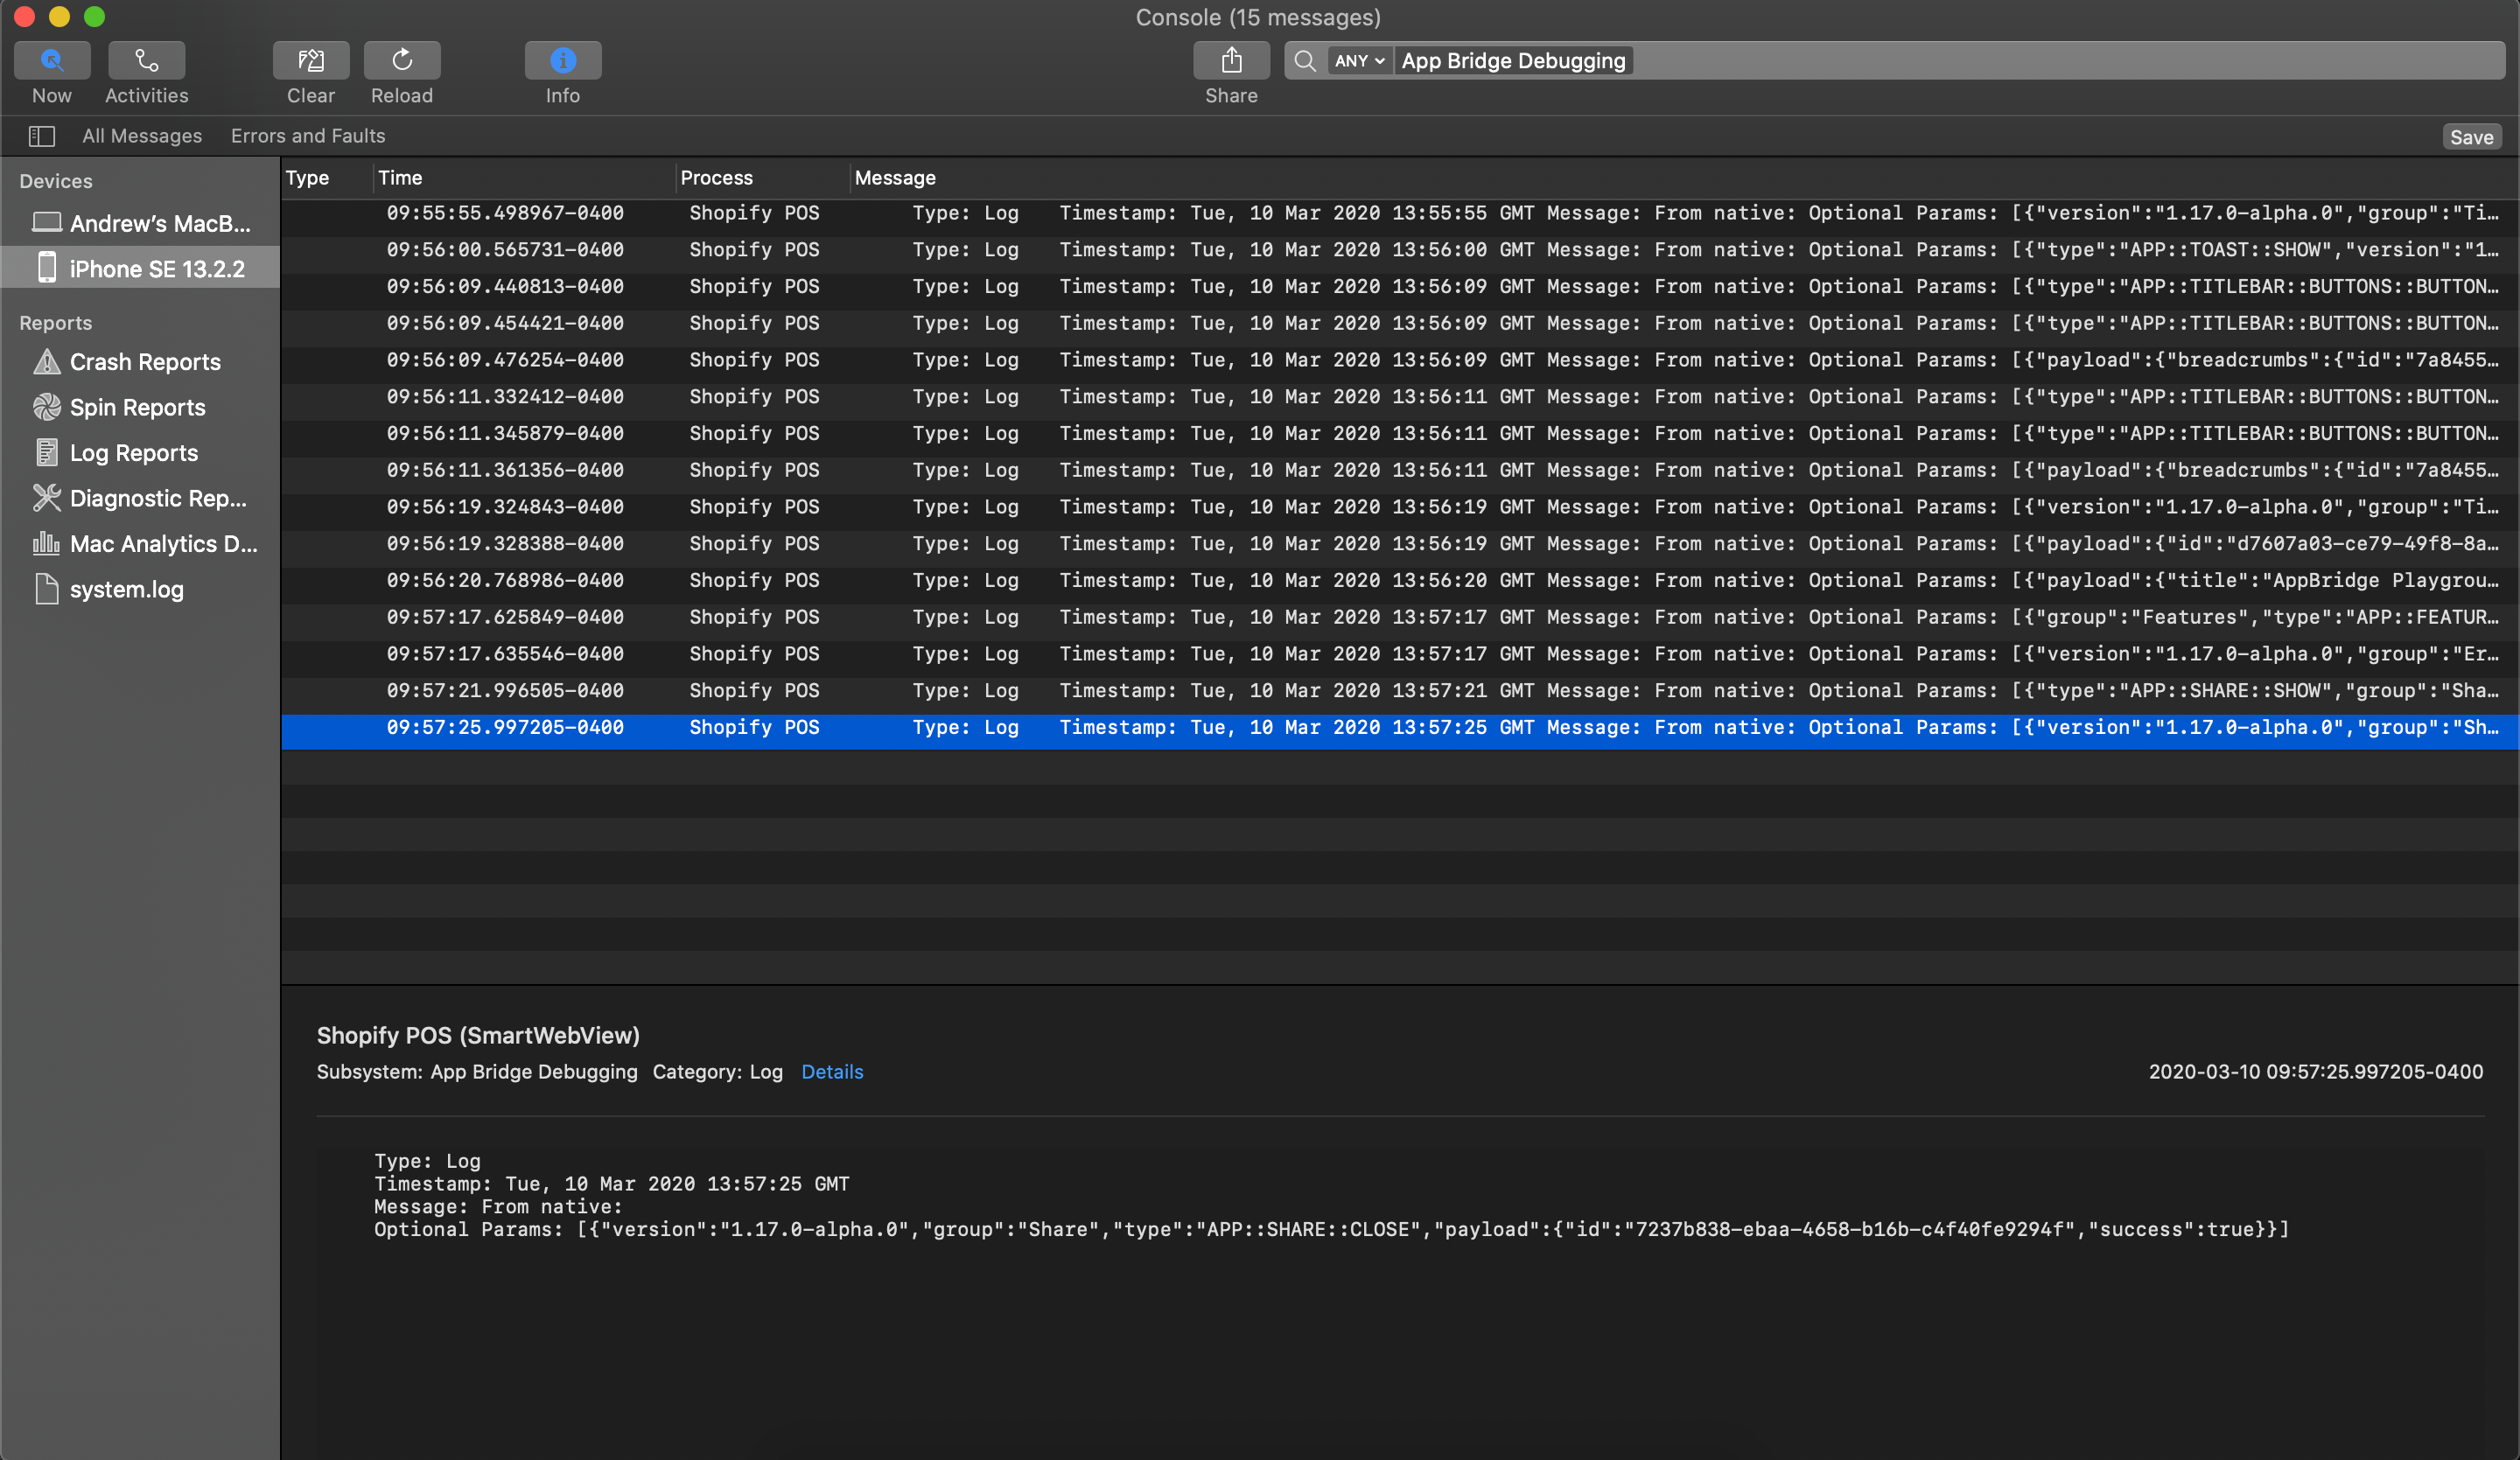
Anchor to Debugging with App Bridge with the Console appDebugging with App Bridge with the Console app
A few steps are required to have your debug messages show up in the Console app.
- Select your iOS device on the left hand panel.
- Enter
App Bridge Debuggingin the search box on the top panel.
All console messages from your App Bridge application will be shown in the list. If you want to see more information, such as the full payload of the message, tapping on the list item will bring up all additional information on the bottom panel.
Anchor to Debugging App Bridge apps on an Android deviceDebugging App Bridge apps on an Android device
To debug an App Bridge app on an Android device, you'll need the following resources:
- An Android device
- A Partner development store
- A desktop computer with the Google Chrome browser installed
Anchor to Debugging in Shopify MobileDebugging in Shopify Mobile
- On the Shopify mobile app, log in to a Partner development store.
- Connect to the Android device to the desktop computer.
- In Google Chrome on desktop, open chrome://inspect. The app's WebView should be in the list of devices.
- Click Inspect for the WebView of your app.
Anchor to Debugging in Shopify Point of Sale (POS)Debugging in Shopify Point of Sale (POS)
The debugging is enabled by default when you log in to a partner development store in Shopify POS. You can open chrome://inspect to inspect the WebView.