Analytics web components
Analytics web components display ShopifyQL data as charts, tables, and lists. A metric card runs a ShopifyQL query and renders the result. A metrics bar arranges cards in a row.
Use these components to add live analytics to an embedded app without building your own charts.
HTML
Anchor to ComponentsComponents
A metric card handles the full lifecycle of a query. It sends the query through App Bridge, waits for the response, formats the values, and renders a visualization. A metrics bar handles layout only and doesn't run ShopifyQL itself.
Each component is a custom element that you add to your HTML.
| Component | What it does |
|---|---|
| Metric card | Renders one ShopifyQL result as a chart, table, or list. |
| Metrics bar | Groups metric cards into a row with consistent spacing and a shared loading state. |
App Bridge loads the ShopifyQL data plugin at window.shopify.shopifyQL. This plugin resolves asynchronously, so it isn't always ready when your code runs. Wait for it before rendering a metric card, or the card will start in an error state.
App Bridge loads the ShopifyQL data plugin at window.shopify.shopifyQL. This plugin resolves asynchronously, so it isn't always ready when your code runs. Wait for it before rendering a metric card, or the card will start in an error state.
Anchor to Access requirementsAccess requirements
Analytics web components read live data through the ShopifyQL data plugin that App Bridge exposes at window.shopify.shopifyQL. The plugin calls the shopifyqlQuery endpoint in the GraphQL Admin API from the browser, so your app needs direct API access along with the same access scopes.
Set up the following in your app before you add analytics web components:
- Enable direct API access by setting
embedded_app_direct_api_accesstotrueunder[access.admin]in your app'sshopify.app.tomlfile, so that your embedded app can call the GraphQL Admin API directly from the browser. Apps configure this themselves, and it doesn't require approval from Shopify. For more information, see App configuration. - Request the
read_reportsaccess scope so that your app can read analytics and reporting data. - Request Level 2 access to protected customer data.
Anchor to Required scriptsRequired scripts
Analytics web components depend on three scripts: App Bridge, Polaris, and the analytics UI script. App Bridge provides the ShopifyQL data plugin that metric cards use to fetch data. Polaris provides the base web components that analytics components build on. The analytics UI script registers ShopifyQL analytics custom elements, including s-shopifyql-metric-card and s-metrics-bar, so you can use them in your app. Add all three as <script> tags in your app's <head>, in the order shown in the example, along with a <meta> tag that holds your app's API key.
HTML
Anchor to TypeScriptType
Shopify provides a companion npm package for analytics web component types, available at @shopify/analytics-ui-types. You can install it in your project using npm or yarn. The analytics UI script always loads the latest components. To keep your types in sync with the components, specify @shopify/analytics-ui-types@latest in your package.json file.
Anchor to Versioning and compatibilityVersioning and compatibility
The components are versionless, but the @shopify/analytics-ui-types package is versioned separately, and it follows semantic versioning:
- Breaking type changes ship in a new major version: A release that removes or narrows part of the public type surface increments the major version, so a major-version bump is your signal to review the changes before you upgrade. Additive changes ship as minor versions, and fixes ship as patch versions.
- You can pin or lock the types: The package is an ordinary dev dependency, so you can pin it to a specific version in your
package.jsonand upgrade on your own schedule. Installing the latest version keeps your types current with new component features, but pinning is fully supported. - Older types stay compatible with the latest components: The types are a development-time aid that's never shipped to merchants, and the versionless components extend their public API in backward-compatible ways. Code that compiles against a supported older version of the types keeps working against the latest components at runtime. Pinning an older version only means that you won't get types for newly added features until you upgrade.
Anchor to QueriesQueries
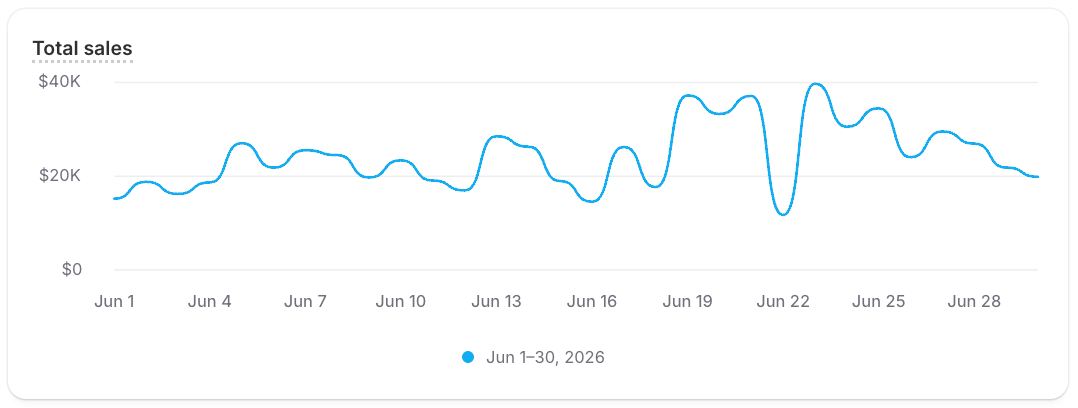
Pass a ShopifyQL query to s-shopifyql-metric-card through the query property. The VISUALIZE clause in your query controls the chart type. Use TYPE line for trends over time, TYPE bar for comparisons, TYPE donut for percentage breakdowns, TYPE list_with_dimension_values for ranked lists, or TYPE table for raw data.
The heading property sets the title at the top of the card. You can also set description for supporting text, size to switch between a full card and a compact KPI, and reportLinkHandle to link the card to a full report.
HTML
Anchor to LayoutLayout
Wrap metric cards in s-metrics-bar to lay them out in a row with consistent spacing, sizing, and a shared loading state. The bar sizes the cards for you, so you don't need to set size on each card. When the cards overflow, the row scrolls horizontally.
You can add an s-metrics-bar-date-picker to the bar to show a range selector above the cards. The picker fires a change event when the selection changes, but it doesn't rewrite card queries. Listen for the event and update each card's query with the matching date range.