Analytics
Shopify Analytics is a platform your app can build on to put your data in front of merchants, in the reports and dashboards they already use, without running your own data infrastructure. Model your data into it, query it with ShopifyQL, embed live charts in your app, and enrich it with merchant context. It's open to your app and to the AI agents that query it for merchants. Everything runs inside Shopify.
Anchor to How it worksHow it works
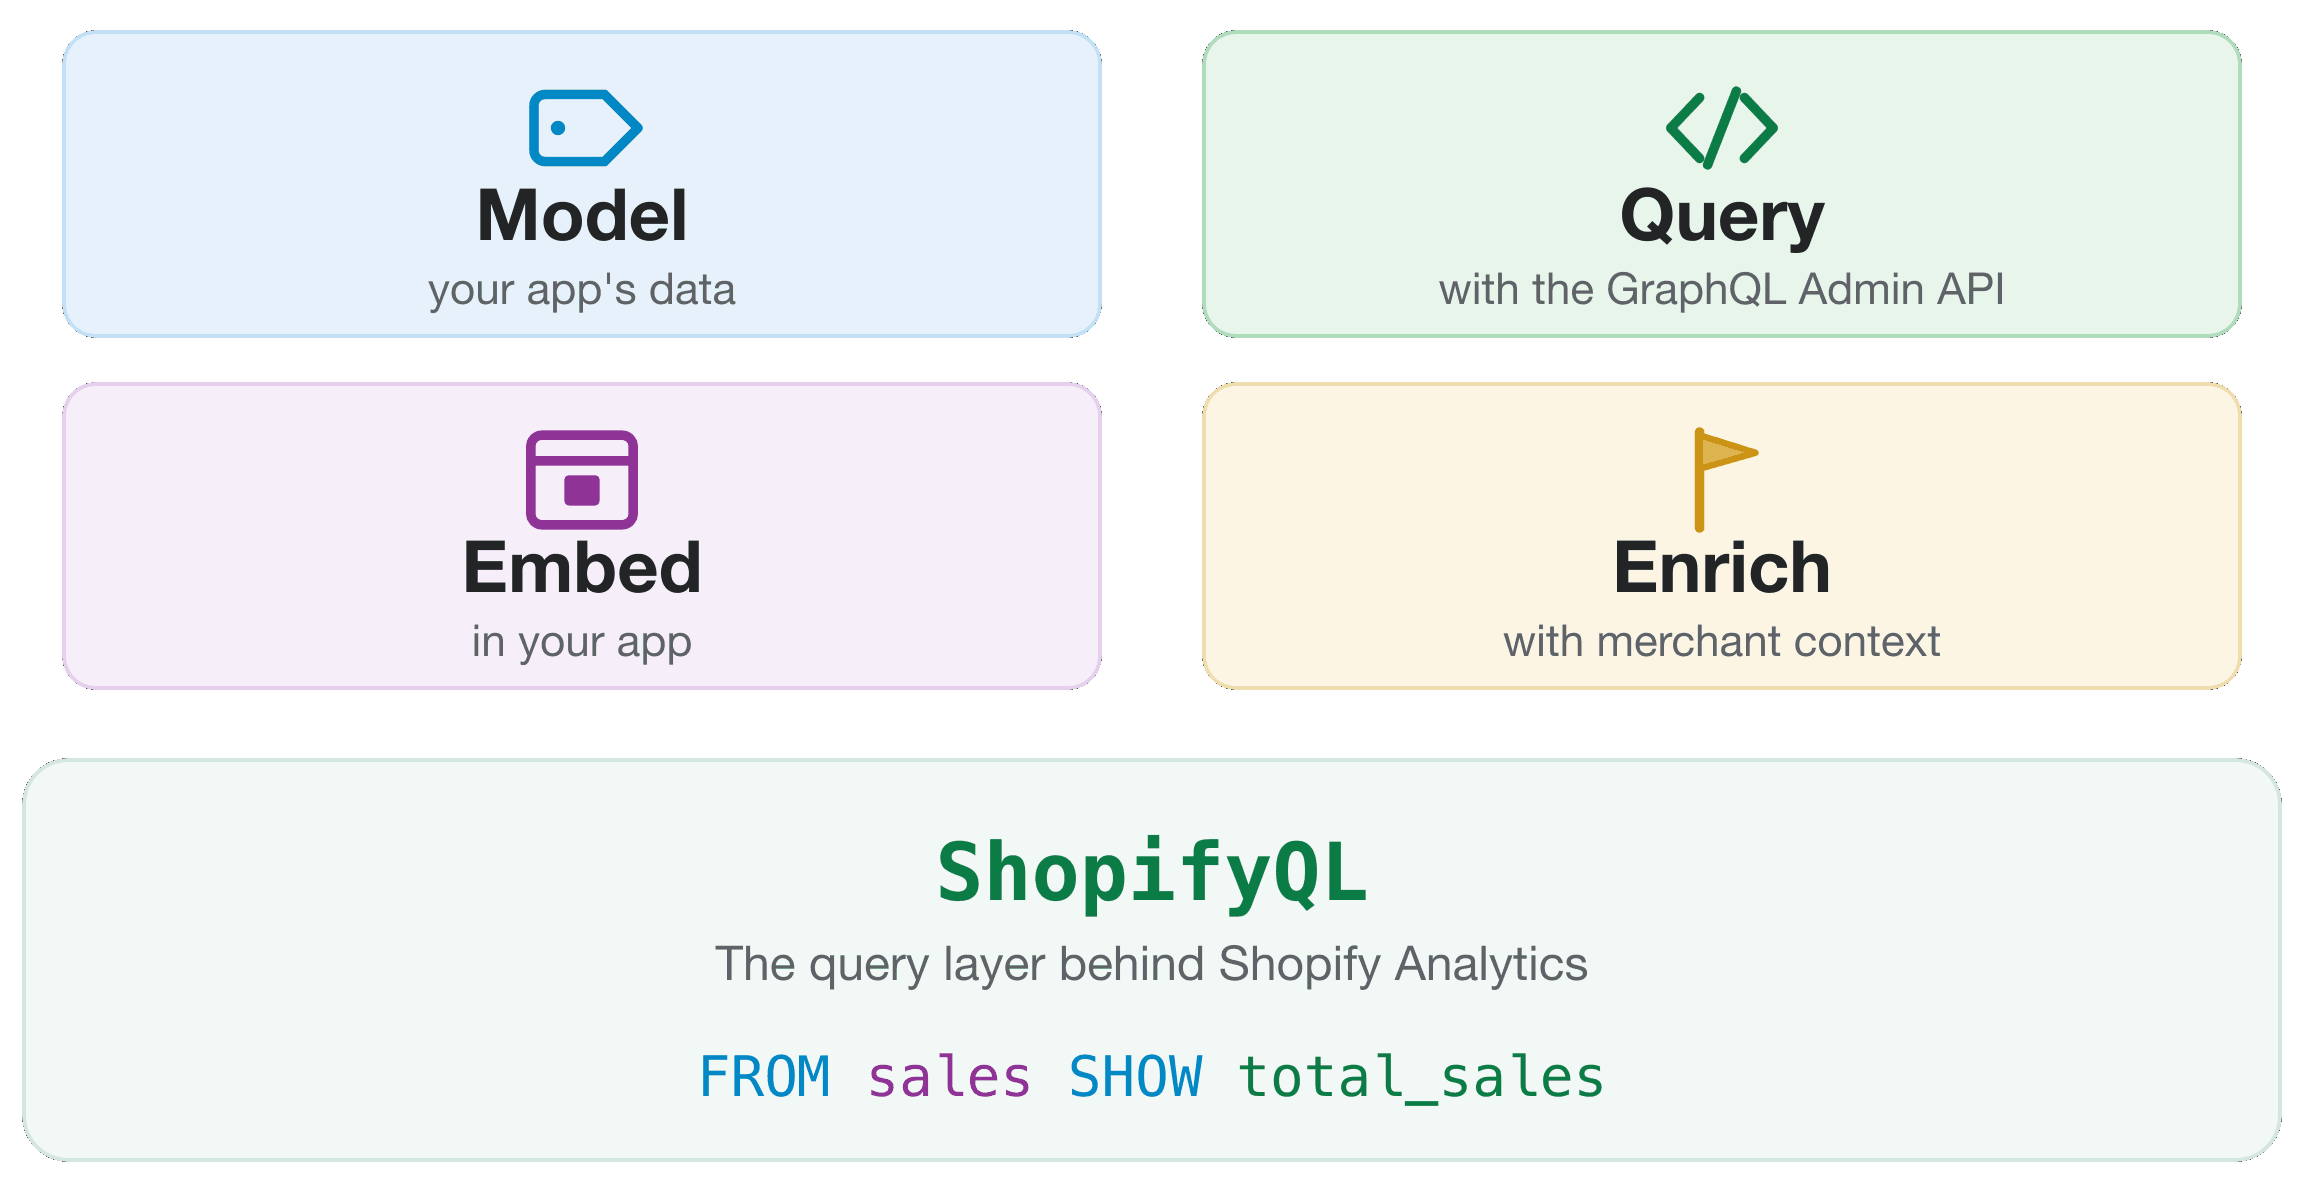
At the center is ShopifyQL, the query language behind Shopify Analytics. The metric cards, dashboards, and reports in the Shopify admin all run on it, and it's how your app reads analytics data. Your app builds on that one query layer with four building blocks you can combine.
For example, here's how it could work for an email marketing app:
- Model your app's data: add a
campaign_sourcemetafield to orders and send anemail_sentApp Event, so both are queryable alongside store data. - Query it with ShopifyQL through the GraphQL Admin API: run a query like
FROM app_events SHOW emails_sent GROUP BY app_name. - Embed it with a web component: show the results on the app's dashboard with a metric card (
<s-shopifyql-metric-card>). - Enrich it with an annotation: mark an event, like a campaign launch, so its impact shows on the merchant's charts.
Anchor to Model your app's data into Shopify AnalyticsModel your app's data into Shopify Analytics
Your app's data becomes queryable in Shopify Analytics without a separate analytics store, whether it comes from metafields on records you already use or from App Events you send.
Anchor to MetafieldsMetafields
Mark a metafield definition as analytics-queryable and its values become a dimension in ShopifyQL, alongside store data. For example, add a campaign_source to an order or a subscription_status to a customer, and merchants can group, filter, and chart on it in reports. The values already live in Shopify.

ShopifyQL query
Anchor to App EventsApp Events
App Events makes the events your app already sends to Shopify queryable in analytics. Declare your events, send them through the App Events API, and merchants can query them in ShopifyQL the same way they query store data. One query can compare the same event across every installed app.
App Events in Analytics is in developer preview. The preview is available to approved apps and supports declared standard events. Sign up for early access.
App Events in Analytics is in developer preview. The preview is available to approved apps and supports declared standard events. Sign up for early access.


ShopifyQL query
Anchor to Query analytics with ShopifyQLQuery analytics with Shopify
Your app runs ShopifyQL through the GraphQL Admin API with the shopifyqlQuery field. Write a query once and run it in the Shopify admin or with the Python SDK. Every metric and dimension is documented with its type and examples, so both developers and AI toolchains can build valid queries.


GraphQL Admin API
Anchor to Embed analytics with web componentsEmbed analytics with web components
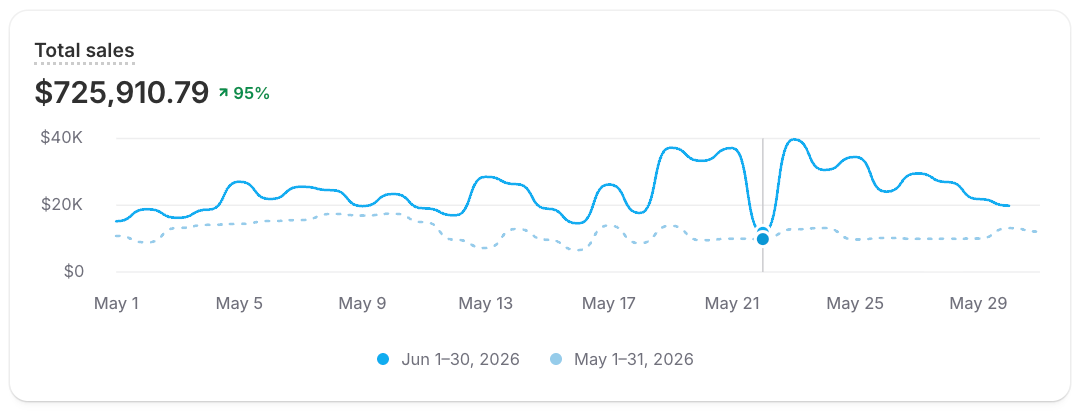
Analytics web components render the same charts the Shopify admin uses, so you can show live analytics in your app without building your own charting, currency handling, or locale formatting. Each component runs a ShopifyQL query.


Metric card
Anchor to Enrich analytics with annotations and targetsEnrich analytics with annotations and targets
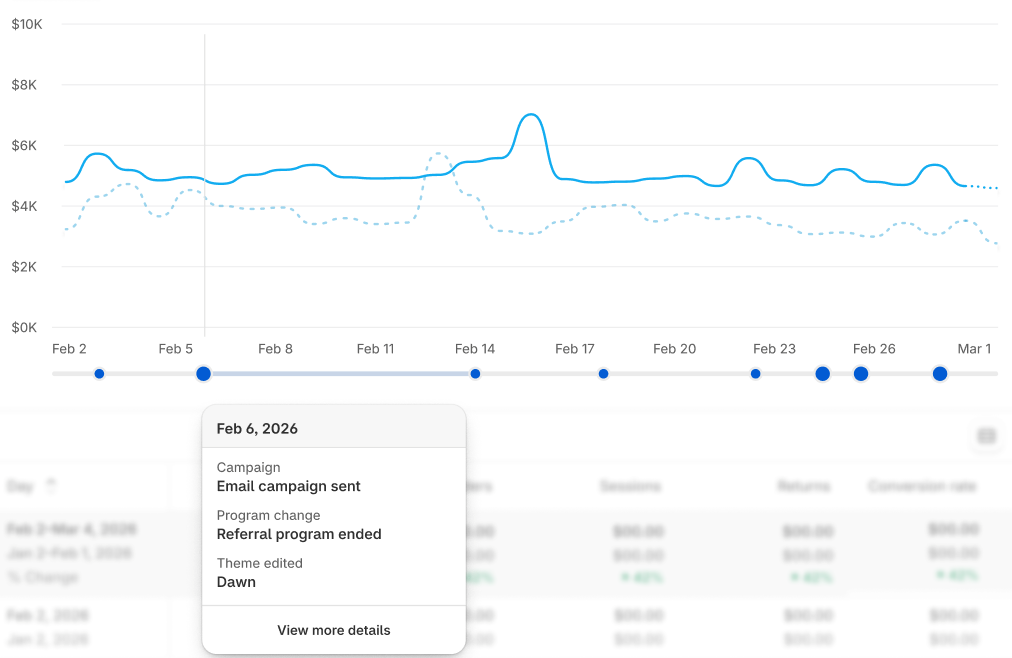
Annotations mark why a metric moved, attributed to your app. A loyalty app can mark the day a program launched, an email app can mark a campaign, and a subscription app can mark a pricing change. Create annotations with the analyticsAnnotationCreate mutation on the GraphQL Admin API, read them with analyticsAnnotations, and overlay them on a chart in ShopifyQL with ANNOTATE.
Metric targets let merchants set a goal for a metric, such as total sales for the quarter, and track progress in reports and dashboards. Create targets with the analyticsTargetCreate mutation on the GraphQL Admin API, read them with analyticsTargets, and compare against them in ShopifyQL with COMPARE TO TARGETS.


Create an annotation
GraphQL Admin API
Overlay on a chart
ShopifyQL