Build your first query
ShopifyQL is Shopify's commerce analytics query language. Every store generates commerce data for each sale, order, and customer, and a ShopifyQL query turns that data into structured results you can chart, embed, or analyze. The same query language runs in the Shopify admin, the GraphQL Admin API, and the Python SDK.
This tutorial starts you in the Shopify admin, where you write a query against a real store and see the results render as you type, before you build anything. You'll learn the shape of the language here, then run the same query from the GraphQL Admin API or the Python SDK when you're ready to move it into code.
For the full ShopifyQL syntax and every dataset, metric, and dimension, refer to the ShopifyQL reference.
For the full ShopifyQL syntax and every dataset, metric, and dimension, refer to the ShopifyQL reference.
Anchor to What you'll learnWhat you'll learn
In this tutorial, you'll learn how to do the following:
- Open the ShopifyQL editor in the Shopify admin.
- Write a query and read its results.
- Shape the query with metrics, dimensions, and a visualization.
- Take the same query to the GraphQL Admin API or the Python SDK.
Anchor to RequirementsRequirements
- A Shopify store, and an account with permission to open the store's Analytics section. This access is set by your staff permissions.
- Store data to run a query against.
Anchor to Step 1: Open the ShopifyQL editorStep 1: Open the Shopify
The ShopifyQL editor is the analytics workspace in the Shopify admin, where you write a query and see its results. To open it, go to Analytics and select New exploration. You can also select Reports to see a list of default queries.
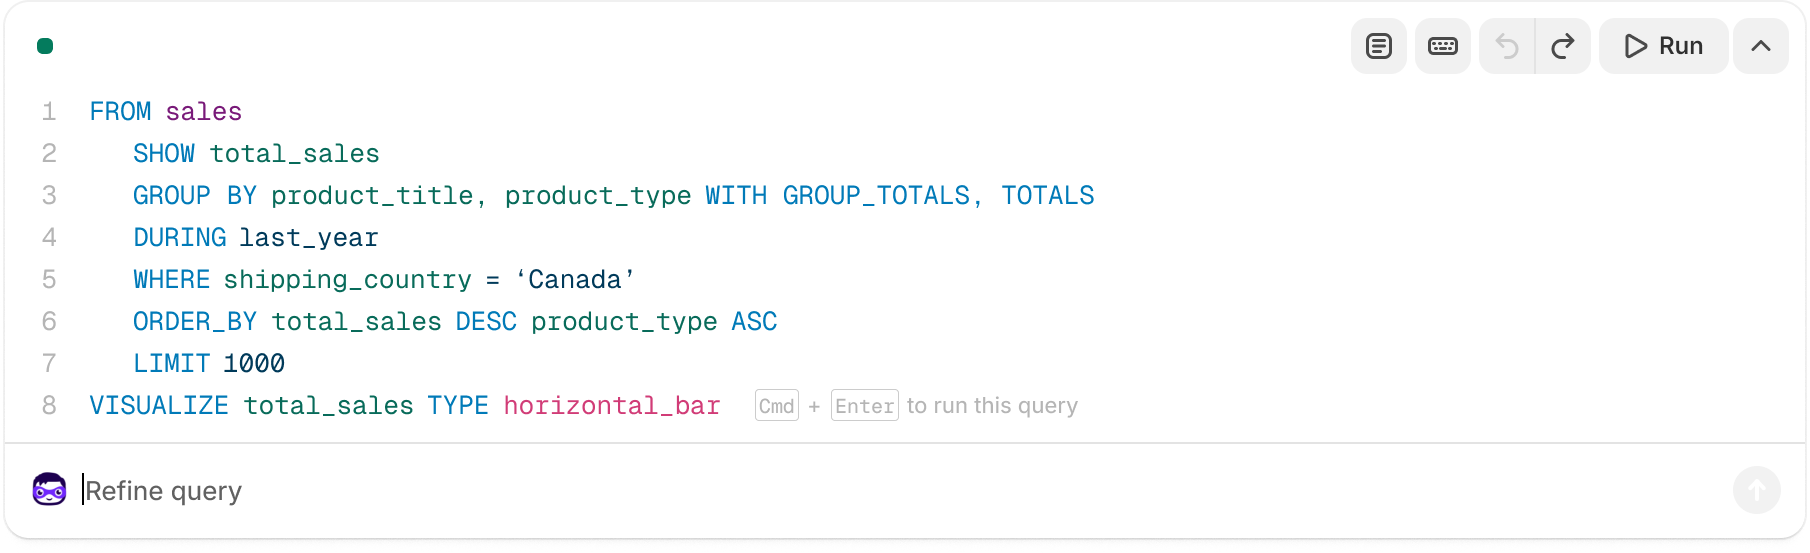
The editor has three parts:
-
The query: Where you type ShopifyQL, or where the editor writes it for you as you use the controls.
-
The controls: The metrics, dimensions, filters, and visualization pickers that write the query for you as you select them.
-
The results: The table or chart that the query returns, updated as you edit.
NoteYou can use the quick filters above the query to set the date range, comparison period, and currency.
Note:You can use the quick filters above the query to set the date range, comparison period, and currency.
Anchor to Step 2: Write a queryStep 2: Write a query
Type a ShopifyQL query directly into the editor. As you type, the editor validates the query and renders the results below as a table or chart. If the query is invalid, then the editor flags the problem so you can fix it before running.
Start with a query that returns daily sales for the last 7 days:
ShopifyQL
Every query has the same shape. FROM picks a dataset, SHOW lists the metrics and dimensions to return, and clauses such as TIMESERIES, SINCE, and ORDER BY shape the rest.
The validation you see here is the same check your app handles in code: a malformed query sent through the GraphQL Admin API returns a parse error instead of results.
The validation you see here is the same check your app handles in code: a malformed query sent through the GraphQL Admin API returns a parse error instead of results.
Anchor to Step 3: Shape the query with the controlsStep 3: Shape the query with the controls
In Step 2, you wrote the query by hand. The editor also works the other way. Its controls build the ShopifyQL for you as you pick what to measure and how to break it down. The metrics and dimensions you select become the query shown in the editor. The editor keeps the two in sync, so you can build a query by clicking, then read the ShopifyQL it generates to learn the syntax.
- Metrics are the values you measure, such as gross sales or orders. They become the columns of your results and map to the
SHOWclause. - Dimensions are the attributes you break metrics down by, such as sales channel or day. They become the rows of your results and map to clauses such as
GROUP BYandTIMESERIES. - Filters narrow the results to the rows you care about, and map to the
WHEREclause.
To watch the sync work, rebuild the Step 2 query with the controls. Choose Gross sales and Orders as your metrics, then break them down by Day over the last 7 days. The editor writes the same FROM sales SHOW gross_sales, orders TIMESERIES day query you typed by hand, so you can see each selection land in a clause.
If you'd rather describe the report in plain language, ask Sidekick, the AI assistant in the Shopify admin, for what you want, such as "gross sales by month for the last year". Sidekick drafts the ShopifyQL and runs it, so you can read the query it produced and adjust from there.
Anchor to Step 4: Choose a visualizationStep 4: Choose a visualization
The visualization control sets how the results are drawn and maps to the VISUALIZE clause. You can draw the same data different ways, depending on the question you're answering. For the sales and orders query you built, a combination chart plots gross_sales as bars and orders as a line on the same time axis, so you can read revenue and order count together.
Choosing that chart adds a VISUALIZE clause to the query, telling the editor to draw gross_sales as bars and orders as a line:
ShopifyQL
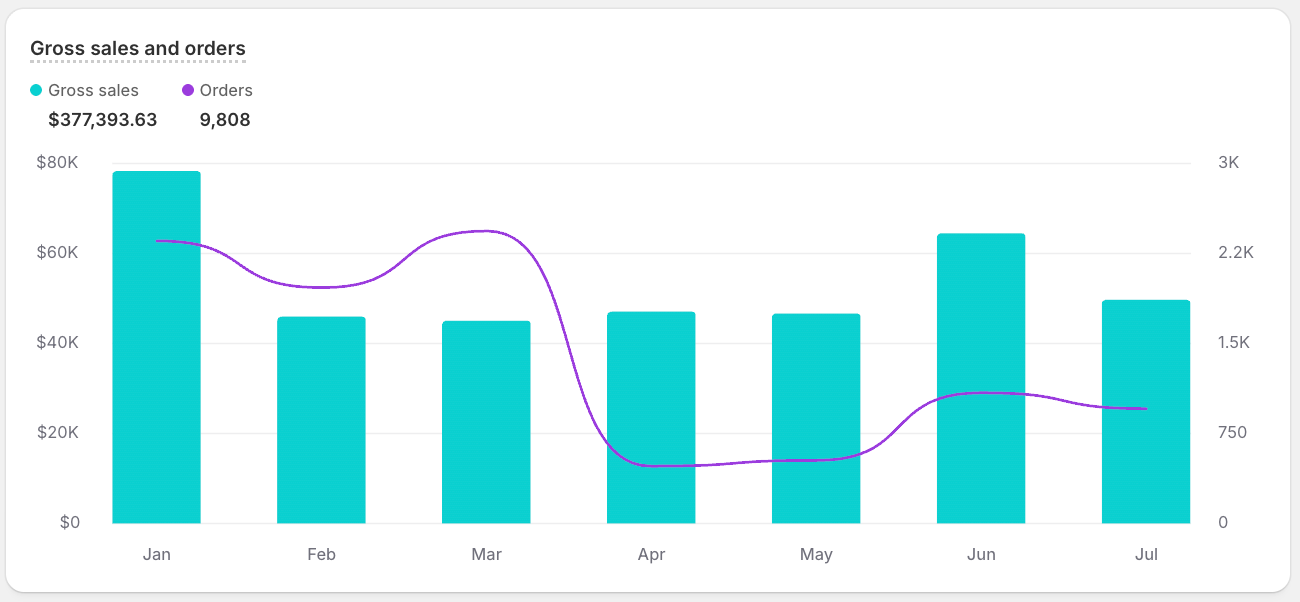
The visualization is a display choice in the editor. The underlying response is always the same set of typed columns and rows. That distinction matters when you move to code. A VISUALIZE clause doesn't change the response shape your app receives, so your app always renders the results itself.
To add context to a timeline, you can mark events such as product launches or app installs directly on the chart with ANNOTATE.
To add context to a timeline, you can mark events such as product launches or app installs directly on the chart with ANNOTATE.
Anchor to Next stepsNext steps
You've learned the language by prototyping in the editor. Now take that same query into code, using the path that fits what you're building. To put analytics inside an app, run the query through the GraphQL Admin API and render the results in your own UI. To explore or export the data, run it from Python and work with the results as a DataFrame.


