Development and debugging
The POS Dev Console and dev store provide tools to help you during development and debugging of your POS UI extensions.
Anchor to Using the POS Dev Console to troubleshoot and refineUsing the POS Dev Console to troubleshoot and refine
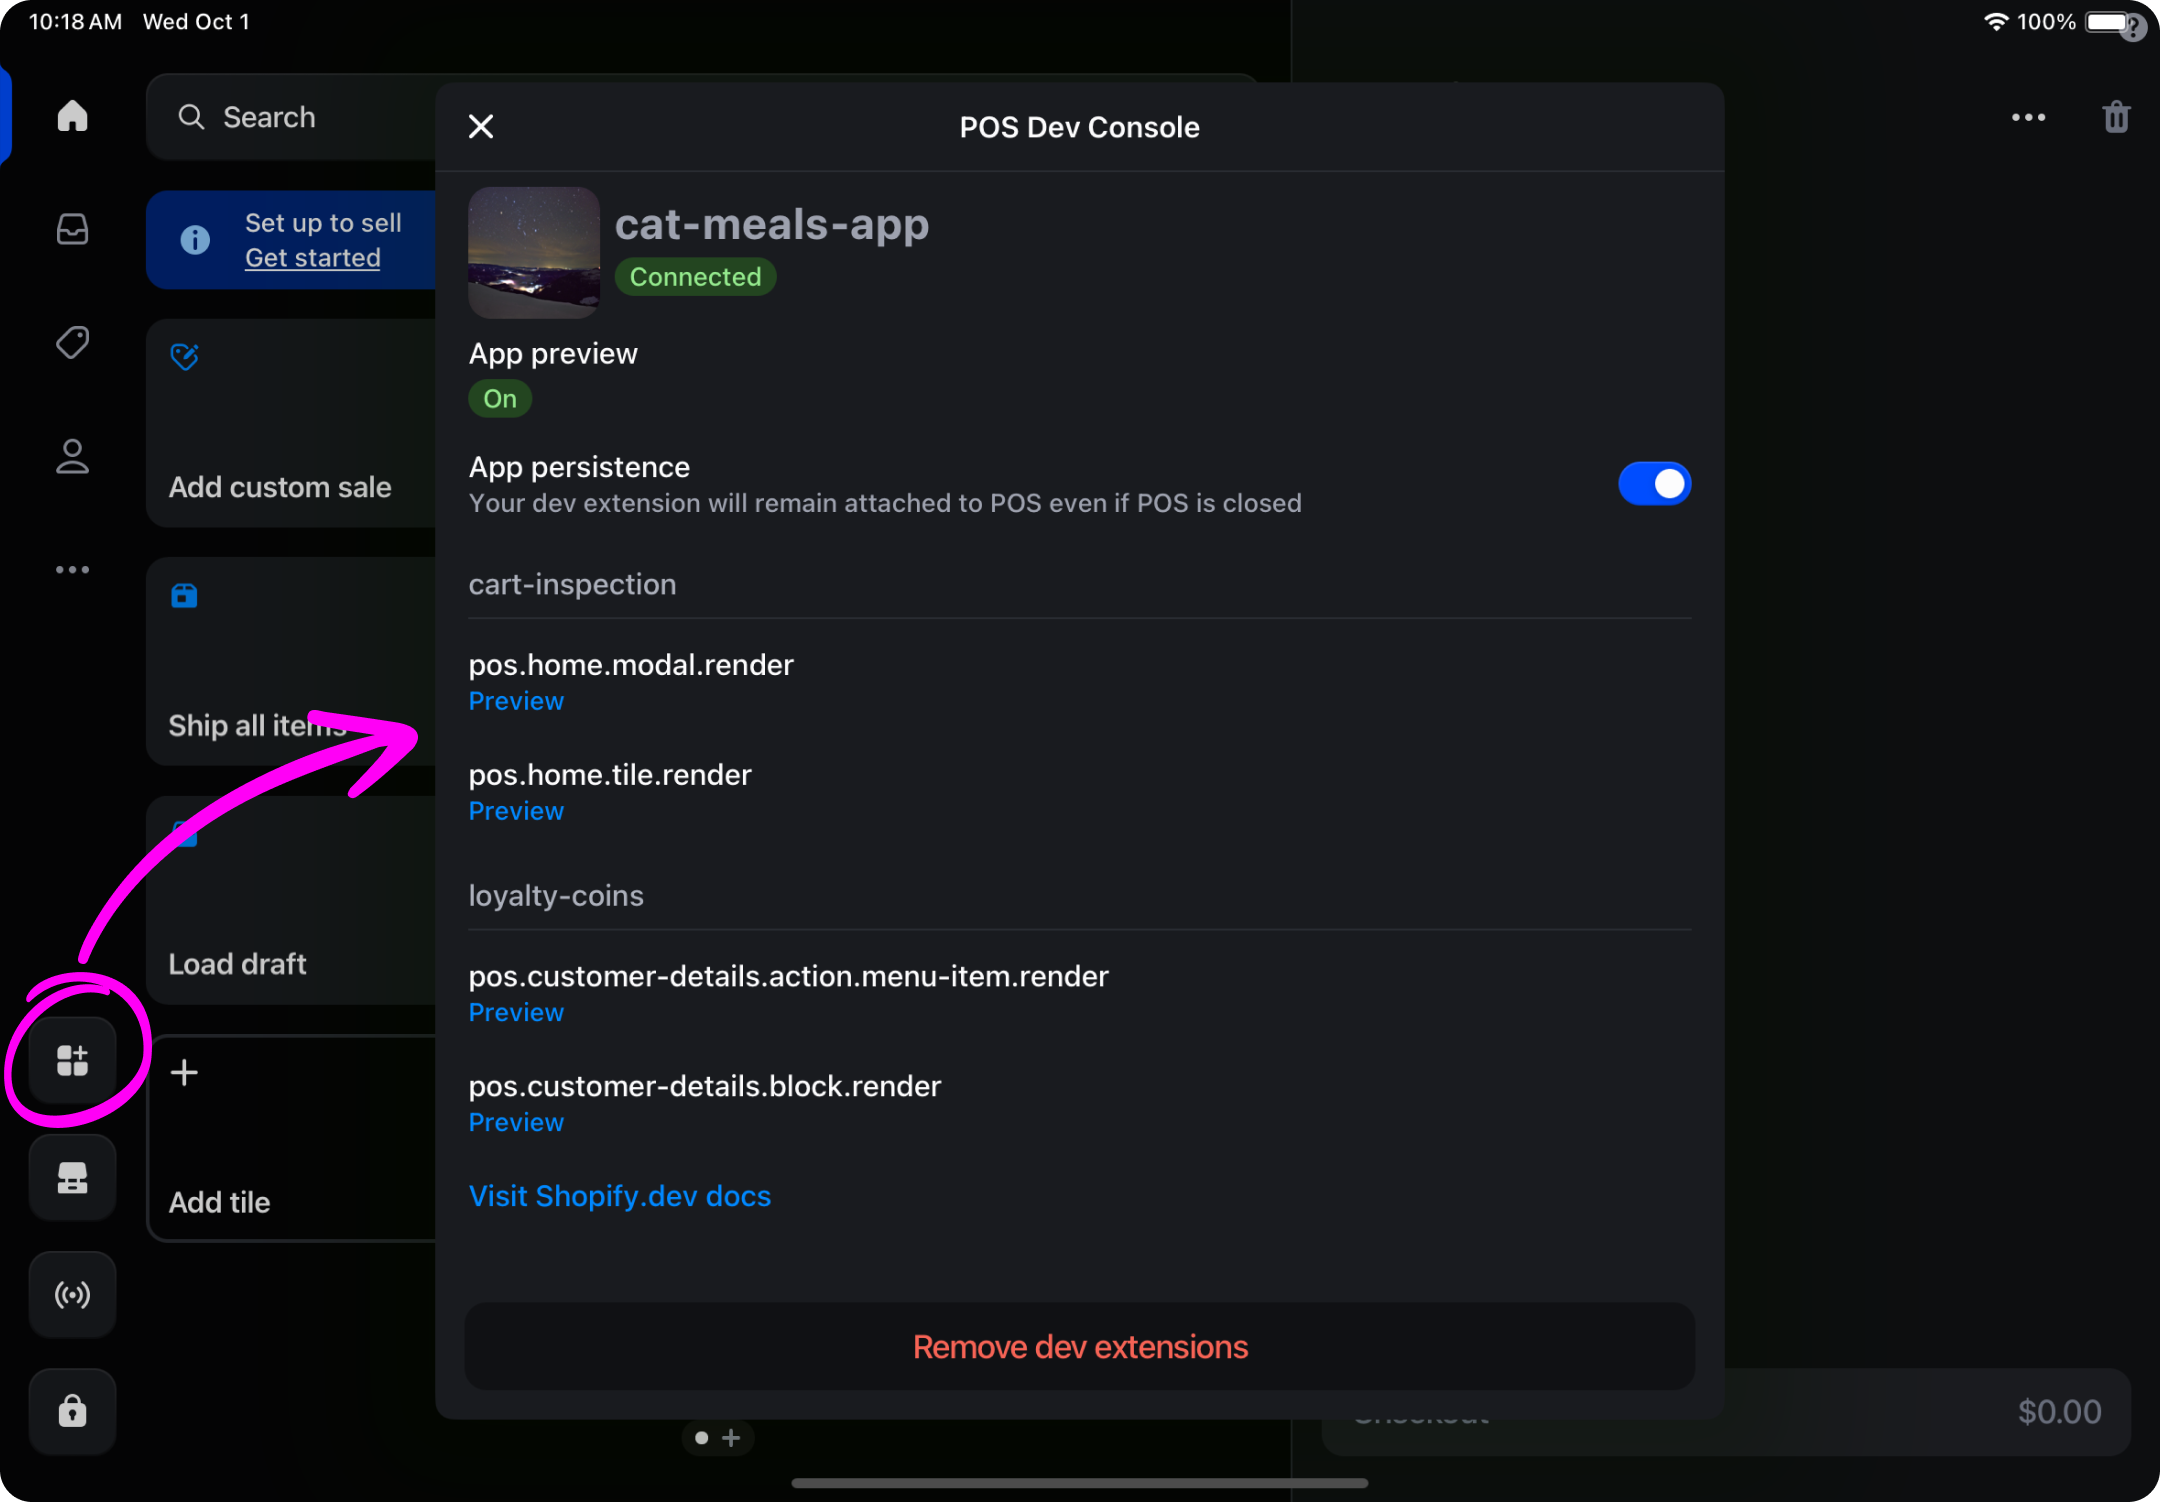
The POS Dev Console provides quick access to extension management during your development process.
To access the POS Dev Console, tap the app icon in the global navigation on the left on tablet experiences, and use the More menu on mobile experiences.
After installing your extension, you can use the console to:
- Check for and identify errors that'll appear next to your extension's name.
- Toggle App persistence to keep your extension active between POS restarts.
- Preview targets without needing to tap through to target locations.
- Remove dev extensions to uninstall all dev extensions.
Anchor to API errorsAPI errors
If an API receives an incorrect parameter, it doesn't attempt to perform the action and throws an error instead. You can view this error either by implementing a try/catch block or by using the Chrome console. For further debugging, you can use console.log to print any additional information in the console.
Anchor to Component errorsComponent errors
If a component is given an incorrect parameter, the extension is replaced with a non-descriptive user interface that indicates an issue has occurred. If the extension is running locally, then you also see the exact error displayed as a toast message. For further debugging, you can use console.log to print any additional information in the console.
In the future we plan to modify this behavior to display the error in the Chrome console instead, aligning with the API approach.
Anchor to Debugging on AndroidDebugging on Android
This section covers how to view POS UI extension logs and errors on Android devices.
Anchor to RequirementsRequirements
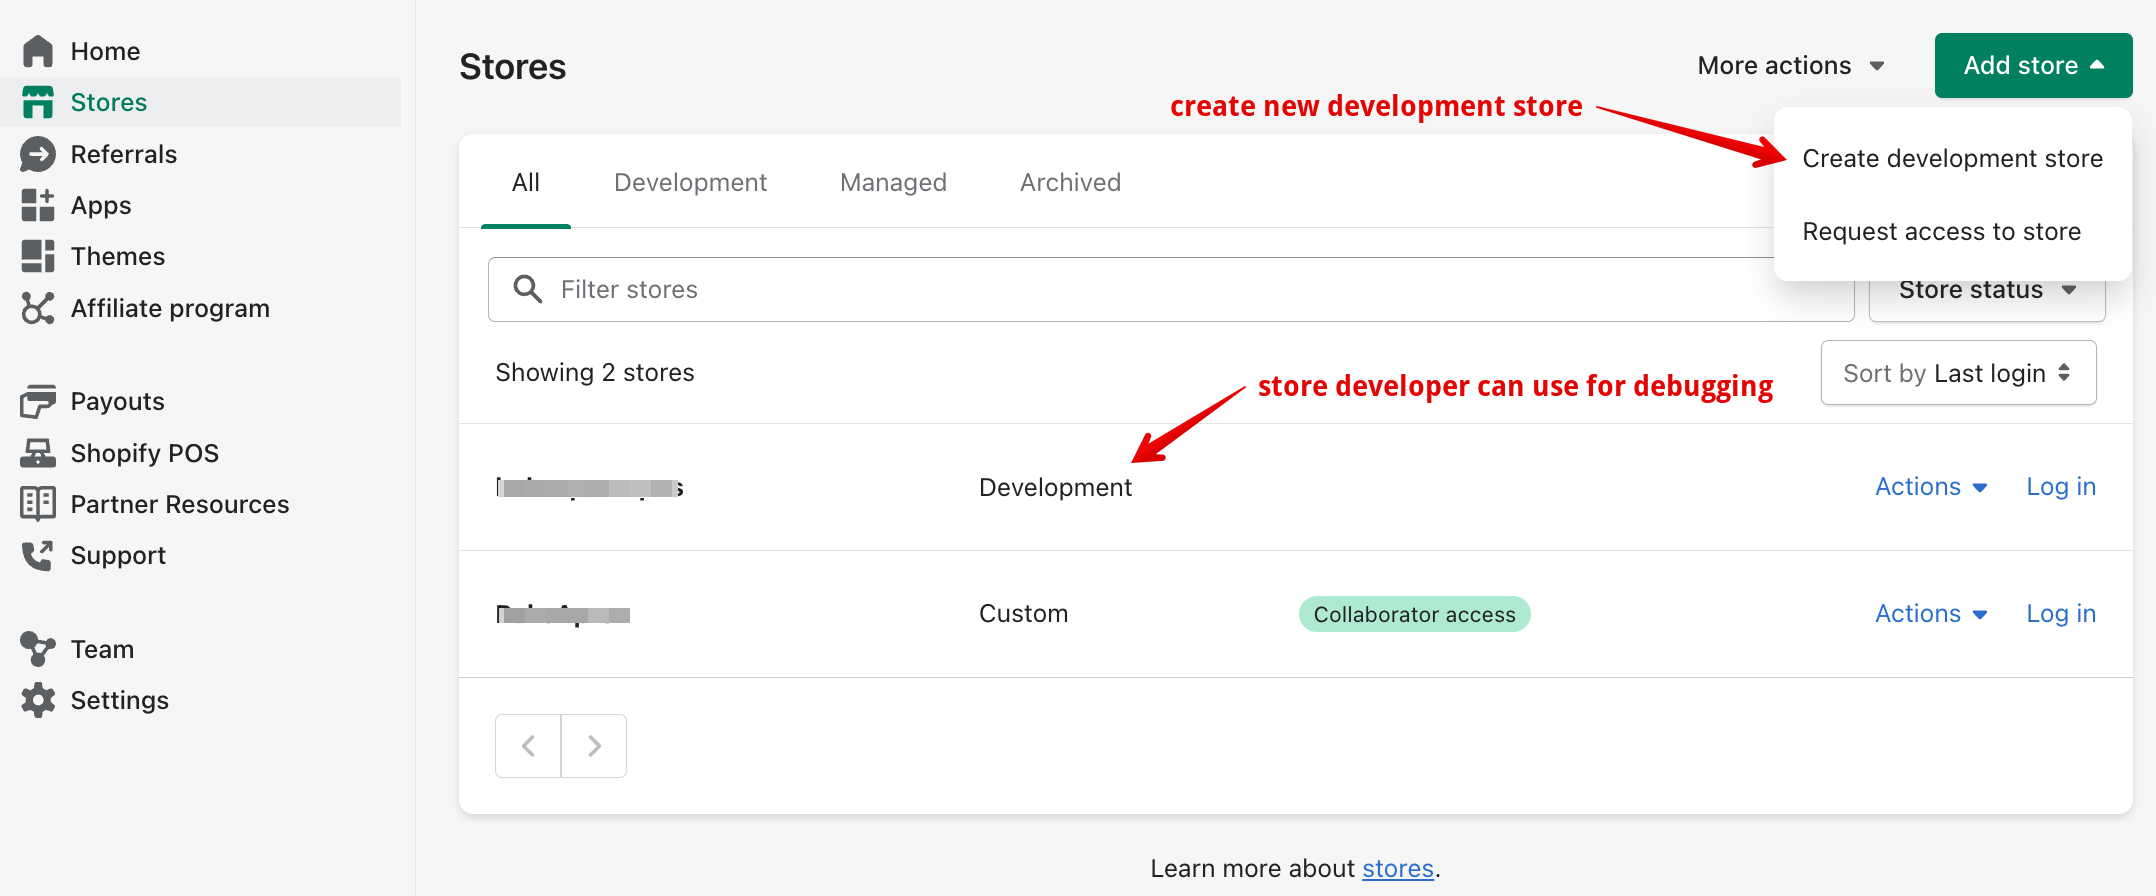
- The extension needs to be running on a dev store in the POS app. Debugging is only available on dev stores. You can create a dev store from the Partner Dashboard, or you can use an existing dev store for debugging purposes.
- You've set up an Android Studio emulator, or you have an Android device available with the POS app installed. If you use an Android device, then you can follow the Chrome developer documentation to set up a device for debugging purposes.
Anchor to StepsSteps
- Connect the Android device to your computer or launch the Android emulator.
- Make sure the POS UI extension is running on the POS app.
- Using Google Chrome, navigate to
chrome://inspect. - The UI extension sandbox should appear on the list as "Shopify UI Extensions Internal".
- Click Inspect to open a DevTools window. You can use this window to interact with the console, view
console.logstatements in your code, and inspect the network activity.
Anchor to Android DemoAndroid Demo
The following demo shows how to debug a POS UI extension on Android by using the Chrome dev tools. The example extension code has console.log statements when the SmartGrid tile is pressed to open modal.
Anchor to Debugging on iOSDebugging on i
This section covers how to view POS UI extension logs and errors on iOS devices.
Anchor to RequirementsRequirements
- The extension needs to be running on a dev store in the POS app. Debugging is only available on dev stores. You can create a dev store from the Partner Dashboard, or you can use an existing dev store for debugging purposes.
- You have an iOS device available with the POS app installed. Follow the Safari documentation to set up dev tooling.
Anchor to StepsSteps
- Connect the iOS device to your computer.
- Make sure the POS UI extension is running on the POS app.
- On your computer, open Safari and select the Develop menu in the top toolbar.
- Select your iOS device to open the device menu.
- Select the
load.htmlcontext. Using the window that opens, you can interact with the console, view `console.log statements, and inspect network activity.
Anchor to iOS Demoi
The following demo shows how to debug a POS UI extension on iOS by using the Safari dev tools. The example extension code has console.log statements that appear when we open the Safari dev tools.