ShopifyQL
ShopifyQL is a query language for commerce. You write a query to ask a question about a store, like total sales last month, and get back a table you can optionally visualize.
It's SQL-like, so if you've written a database query before, it'll feel familiar. We provide various schemas covering sales, orders, customers, marketing, inventory, payments, and more, so questions about your store map to a schema you can query.
Anchor to Getting startedGetting started
Start with a question about your store and write it as a query. Each example adds one clause to the previous one, building from a simple total to more advanced queries.
How much did I sell last month?
FROM picks the sales schema, SHOW picks the total_sales metric, and DURING last_month sets the window. The result is a single total.
How are sales trending day to day?
Add TIMESERIES day to turn that single total into a daily series, and set the window with SINCE and UNTIL. The result has one row per day, ready to plot as a line.
Which channels drive the most sales?
Add GROUP BY sales_channel to split the total by channel, then ORDER BY total_sales DESC to rank them. Each channel comes back alongside its sales.
How do sales compare to the period before?
Add COMPARE TO previous_period to put each month next to the one before it. Pair it with TIMESERIES month so the comparison lines up period by period.
Total sales last month


Anchor to Running ShopifyQLRunning Shopify
You write a query once and run the same query across the tools you already use. The query is identical everywhere, and only the call around it changes.
| If you… | Use |
|---|---|
| Explore, visualize, save, or share reports with live data | ShopifyQL editor in the Shopify admin |
| Build queries into an app backend or dashboard | shopifyqlQuery in the GraphQL Admin API |
| Analyze or export data in scripts or notebooks | Python SDK and CLI |
| Render a metric as a chart in your app UI without writing charting code | Metric card web component |
ShopifyQL editor
ShopifyQL
The editor displays the results, which you can chart, save, or share as a report:
| Month | Total sales | Orders |
|---|---|---|
| 2026-01-01 | 10000.00 | 25 |
GraphQL Admin API
Request
Response
Python
Request
Response
Web component
HTML
The card runs the query and renders the result as a chart in your app, choosing a visualization when the query has no VISUALIZE clause.
ShopifyQL
The editor displays the results, which you can chart, save, or share as a report:
| Month | Total sales | Orders |
|---|---|---|
| 2026-01-01 | 10000.00 | 25 |
Anchor to Parts of a queryParts of a query
Every ShopifyQL query comes down to three parts: the syntax you write, the schema you write it against, and the web component you use to visualize the result of the query.
Anchor to SyntaxSyntax
Syntax is the clauses you write and how you combine them. FROM is required, and every query needs result selection through SHOW or VISUALIZE. Use SHOW to choose returned columns. If you omit SHOW, use VISUALIZE to select the metric to render. The other clauses each shape the result, such as filtering rows with WHERE or grouping by a dimension with GROUP BY.


ShopifyQL syntax
Anchor to SchemasSchemas
A schema is a queryable dataset and the fields it exposes: the metrics you can measure and the dimensions you can break them down by. The schema you pick with FROM decides which fields the rest of your query can use, so it's the first choice you make in any query.

Sales schema fields
Anchor to Web componentsWeb components
Web components embed ShopifyQL directly in your app's UI. A component like the metric card takes a query, runs it, and renders the result as a chart, so you can surface analytics in your app without writing any charting code.


Metric card web component
Anchor to Visualization and renderingVisualization and rendering
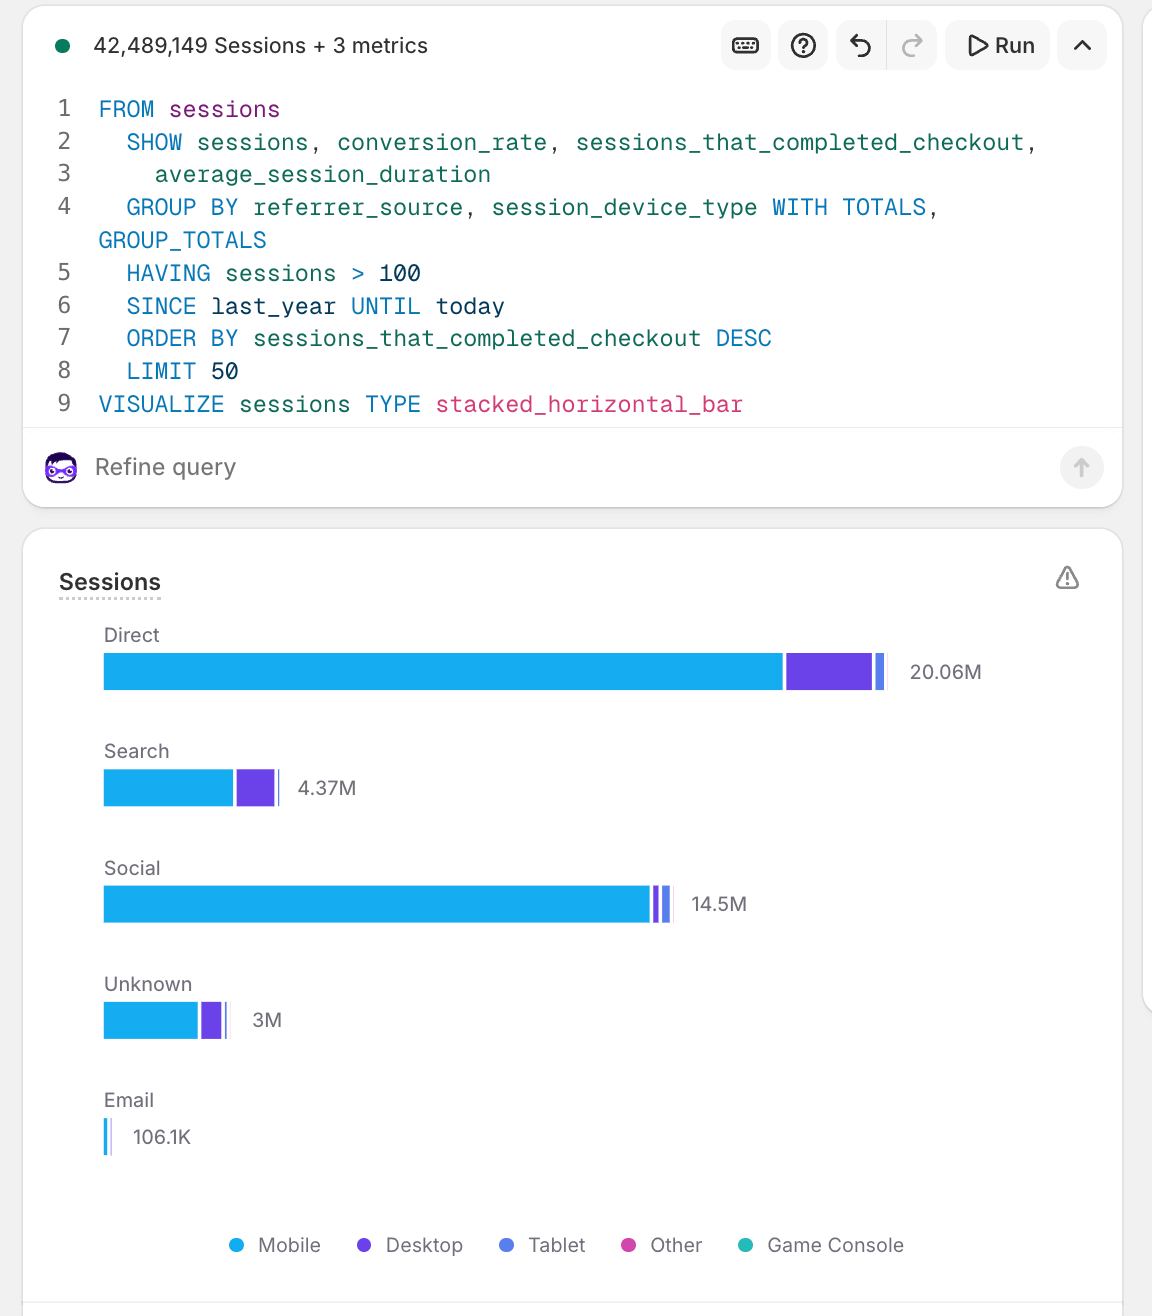
In the ShopifyQL editor, VISUALIZE sets the chart you see. Through the GraphQL Admin API or the Python SDK and CLI, the same query returns table data, and your app renders the chart from the rows. Analytics web components render the VISUALIZE chart directly in your app's UI. You embed the component and pass it a ShopifyQL query, and it renders the chart for you.
Set a chart type with TYPE, like line or horizontal_bar, and ShopifyQL picks one for you if you leave it off.
ShopifyQL supports chart types for comparisons, trends, distributions, funnels, and single metrics. Overlay contextual events on a time-based chart with ANNOTATE.
Anchor to References and tutorialsReferences and tutorials
Deepen your understanding of ShopifyQL with these references and tutorials.


